

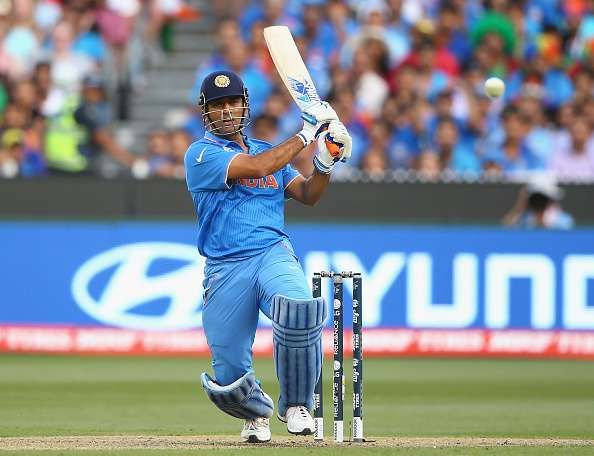
When it comes to MS Dhoni, the country is filled with mixed opinions. It is a rare, rare combination when a cricketer has as many diehard followers in his own country as he has Indian cricket fans who do not approve of him.
The mixed opinions are perhaps justified. There are schools of thought that Dhoni plays too slowly, that he was responsible for driving out senior players from the side, that he plays his own pets and that he is not open-minded in selections et al.
On the other hand, Dhoni is a captain who has won it all. There is hardly a trophy that is missing from his cabinet. From the World T20 in 2007, the coveted Cricket World Cup four years later, the IPL trophy, the Champions Trophy as well as leading India to the No. 1 ranking in Tests, Dhoni is perhaps India’s most successful captain, and probably the most successful captain of the current millennium.
However, there are two aspects to Dhoni – Dhoni the captain and Dhoni the batsman.
Whilst there is no way one can discuss with conviction a subjective topic such as captaincy, the batting stats are there for everyone to evaluate. Let us go through the ODI statistics of MS and evaluate whether the criticism he has received is justified or if it is nothing more than his dislikers creating a hoax.
Before we begin, let us make one thing amply clear – if you were a great player in the past, it by no way justifies your place in the side. Kapil Dev was a great player too. But he can’t waltz into the Indian cricket set today. Similarly, whilst there is no doubt that MS has been a great player for India, what matters is how he is performing recently.
For that reason, the analysis is based on the last two years of cricket – starting from 1st June 2014.
MSD in ODIs
Let us look at the stand-alone figures of MS Dhoni in ODIs since 1st June 2014.
| Matches | Innings | Runs | Batting Average | Strike Rate | 100s | 50s |
|---|---|---|---|---|---|---|
| 33 | 27 | 872 | 37.91 | 89.61 | 0 | 6 |
Considering MS plays mostly at No. 5 and No. 6, let us see how he does at those positions and then compare with players from all over the world.
| Matches | Innings | Runs | Batting Average | Strike Rate | 100s | 50s |
|---|---|---|---|---|---|---|
| 27 | 22 | 691 | 38.38 | 92.87 | 0 | 5 |
Looking at these figures on a standalone basis, what is most surprising is that for players playing at No. 5 and No. 6 for all countries, there are 12 batsmen with a better average than MS Dhoni during this period! And this is after Dhoni’s own figures have improved from overall to when he’s batting at No. 5 and No. 6.
Yes indeed, out of 10 Test playing nations, the No. 5 and No. 6 of as many as eight nations have a better record than MS when it comes to comparing these players by their batting average (minimum of 10 innings).

One could counter argue that when a player is batting at No. 5 and No. 6, strike rate plays a more important role. However, there are 13 players who have a better strike rate than MS whilst batting at those positions, laying claim to the fact that neither is Dhoni performing consistently nor is he playing at a ferocious pace.
And to put the final nail in the coffin, as many as six players (from five different nations) have a better strike rate as well as a better average as compared to MS Dhoni!
Indeed, for someone who was once the best finisher in the world, the stats cut a sorry figure.
Career stats for players batting at No. 5 and No. 6 from 1st June 2014
| Name | Matches | Innings | Runs | Batting Average | Strike Rate | 100s | 50s |
|---|---|---|---|---|---|---|---|
| Ab de Villiers (SA) | 15 | 14 | 803 | 114.71 | 128.68 | 2 | 6 |
| Shoaib Malik (Pak) | 15 | 15 | 527 | 58.55 | 103.13 | 0 | 4 |
| Dinesh Chandimal (SL) | 10 | 10 | 313 | 52.16 | 95.42 | 0 | 3 |
| Mohammed Rizwan (Pak) | 12 | 11 | 324 | 40.50 | 96.42 | 0 | 3 |
| David Miller (SA) | 35 | 30 | 923 | 40.13 | 105.97 | 2 | 2 |
| Grant Elliot (Nzl) | 31 | 28 | 942 | 39.25 | 98.74 | 1 | 5 |
| MS Dhoni (Ind) | 27 | 22 | 691 | 38.38 | 92.87 | 0 | 5 |
| Angelo Mathews (SL) | 39 | 32 | 1330 | 55.41 | 89.62 | 1 | 9 |
| Lahiru Thirrimane (SL) | 12 | 11 | 330 | 47.14 | 71.12 | 0 | 4 |
| Mitchell Marsh (Aus) | 19 | 19 | 593 | 42.35 | 91.23 | 1 | 4 |
| James Taylor (Eng) | 10 | 10 | 292 | 41.71 | 89.84 | 0 | 3 |
| Sean Williams (Zim) | 20 | 20 | 738 | 41.00 | 91.56 | 0 | 8 |
| Shakib Al Hasan (Ban) | 22 | 19 | 579 | 38.60 | 89.76 | 1 | 5 |
As clearly evident from the table, players from South Africa, Pakistan, Australia, England, Sri Lanka, New Zealand and even Bangladesh and Zimbabwe have had better batting averages than MS Dhoni, implying that what initially seemed good figures are actually woeful, to say the least.
Currently, West Indies is the only country who’s No. 5 and No. 6 have not performed better than MS – meaning India have the second worst performance in these batting positions!
Home and away
Another important metric to judge a player is by his performances home and away. Let us look at how MS Dhoni has performed home and away in the selected period.
Dhoni Home and Away
| Matches | Innings | Runs | Average | Strike Rate | 100’s | 50’s | |
| Home | 8 | 8 | 277 | 46.16 | 96.18 | 0 | 2 |
| Away | 25 | 19 | 595 | 35.00 | 86.86 | 0 | 4 |
Dhoni Home and Away at No. 5 and No. 6
| Matches | Innings | Runs | Average | Strike Rate | 100’s | 50’s | |
| Home | 7 | 7 | 230 | 46 | 101.23 | 0 | 2 |
| Away | 20 | 15 | 461 | 35.46 | 89.16 | 0 | 3 |
As is evident, Dhoni clearly has been better at performing at home than away from home. An average of 35 away from home is modest, to say the least.
As many as 10 players (including Irish batsman Gary Wilson) have a better average than MS Dhoni batting at No. 5 and No. 6 away from home (minimum of 10 matches).
Speaking of strike rates, Dhoni is no better in that area, with as many as nine batsmen having a better strike rate overseas as compared to the Indian captain. To sum it up, as many as eight batsmen in the world have a better strike rate and average combined as compared to MS Dhoni overseas (including southpaw Suresh Raina, who was dropped!).
Yet again, Dhoni's stats fail to prove that he has performed well over the last two years.
Winning and losing causes
One of the biggest praises that Dhoni receives is that he’s the finisher – the match winner. Let us look at how Dhoni has done in winning and losing causes and how others have performed (at No. 5 and No. 6) in winning causes.
MS Dhoni in wins and losses
| Matches | Innings | Runs | Average | Strike Rate | 100’s | 50’s | |
| Wins | 17 | 12 | 491 | 61.37 | 101.44 | 0 | 5 |
| Losses | 15 | 15 | 381 | 25.4 | 77.91 | 0 | 1 |
MS Dhoni in wins and losses at No. 5 and No. 6
| Matches | Innings | Runs | Average | Strike Rate | 100’s | 50’s | |
| Wins | 15 | 11 | 422 | 60.28 | 103.68 | 0 | 4 |
| Losses | 11 | 11 | 269 | 24.45 | 79.82 | 0 | 1 |
An average of 24.45 in losses is really below par. It shows that you have hardly played a lone hand and when the team hasn’t performed well, even you haven’t.
Coming to when the team has won, an average of 60.28 and a strike rate of 103.68 may look good on a standalone basis, but as many as seven players batting at No. 5 and No. 6 have a better batting average as compared to Dhoni in winning causes (minimum of 4 matches).
As many as 14 players have played faster than Dhoni in winning causes, again laying claim to the fact that Dhoni has neither played at a belligerent rate nor has he played as consistently as players all over the world.
To sum it up, as many as five players have a better strike rate as well as average when compared to MS Dhoni in winning causes, reinforcing the fact that he isn’t the match winner that he used to be in his heyday.
Conclusion
Whilst the facts and figures may seem good on a standalone basis, when you compare them with players all over the world, Dhoni is found clearly lacking. He isn’t even the fifth best No. 5 or No. 6 in the world, let alone being among the best in the world right now.
The brickbats are well-founded, the facts are there for all to see. Dhoni has seen a sharp decline in his career and his place in the national side is definitely questionable. It remains to be seen whether there is a last hurrah remaining in the Indian captain or will he fade away into oblivion.
Looking for fast live cricket scores? Download CricRocket and get fast score updates, top-notch commentary in-depth match stats & much more! 🚀☄️
